Manipulate grids lines when plotting Maps#
Underneath the hood, sunpy.map.GenericMap.plot uses WCSAxes to have to ability to plot images in world coordinates.
This means that sometimes the standard matplotlib methods to manipulate grid lines may not work as expected.
So you have to access the WCSAxes object to manipulate the grid lines.
Astropy have a guide on how to manipulate grid lines in WCSAxes.
Here we provide a solar example of how to manipulate grid lines when plotting a GenericMap.
Turning off the Helioprojective grid#
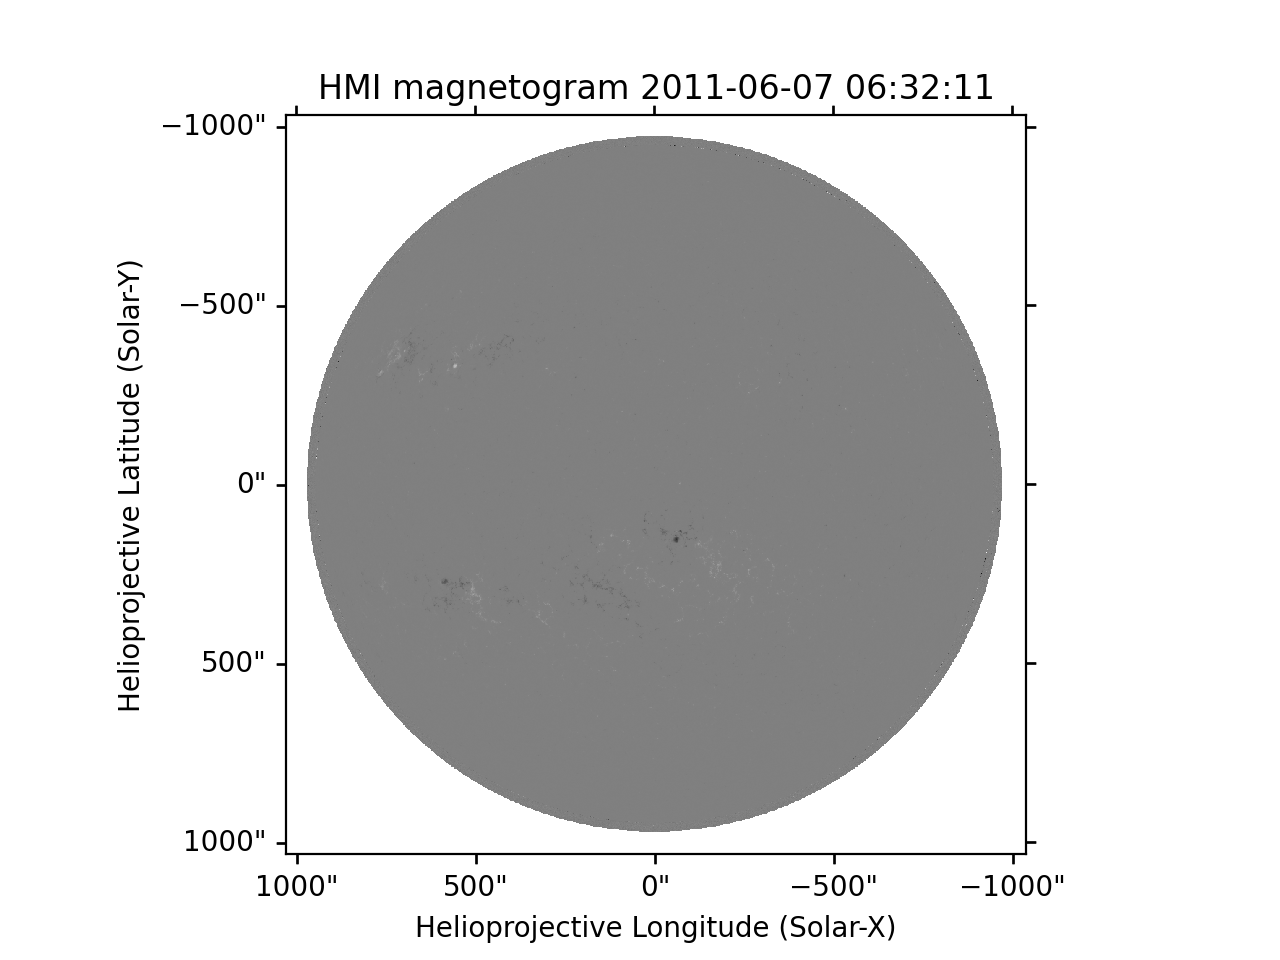
By default sunpy.map.GenericMap.plot draws a grid tracing the lines of helioprojective latitude and longitude, as below:
import matplotlib.pyplot as plt
import astropy.units as u

import sunpy.map
from sunpy.data.sample import HMI_LOS_IMAGE

smap = sunpy.map.Map(HMI_LOS_IMAGE)

fig = plt.figure()
ax = fig.add_subplot(111, projection=smap)

smap.plot(axes=ax)

plt.show()
(Source code, png, hires.png, pdf)

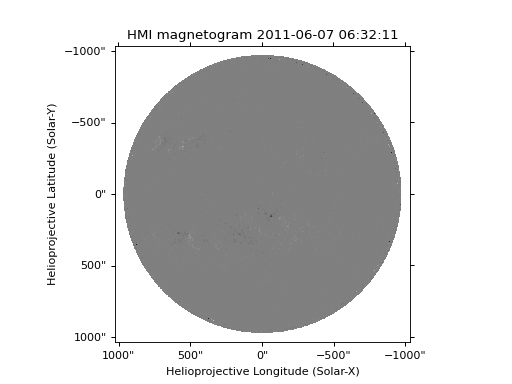
In some cases it may be desirable to remove this grid.
Since the underlying axes is a WCSAxes, you will need to access the grid method on the axes’ object coord attribute:
fig = plt.figure()
ax = fig.add_subplot(111, projection=smap)

smap.plot(axes=ax)

ax.coords[0].grid(draw_grid=False)  # Disable grid for 1st axis
ax.coords[1].grid(draw_grid=False)  # Disable grid for 2nd axis

plt.show()
(Source code, png, hires.png, pdf)
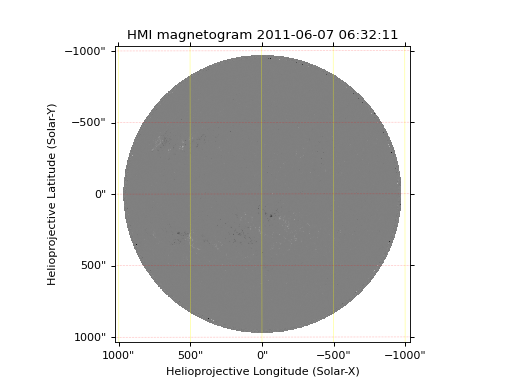
Changing the appearance of Helioprojective grid#
As the Helioprojective grid is applied by WCSAxes, if you want to change the appeerance of the grid lines, you will need to access the grid method on the axes’ object coord attribute and pass the desired keywords to it:
fig = plt.figure()
ax = fig.add_subplot(111, projection=smap)

smap.plot(axes=ax)

ax.coords[0].grid(color='yellow', linestyle='solid', alpha=0.5)
ax.coords[1].grid(color='red', linestyle='dotted', alpha=0.5)

plt.show()
(Source code, png, hires.png, pdf)

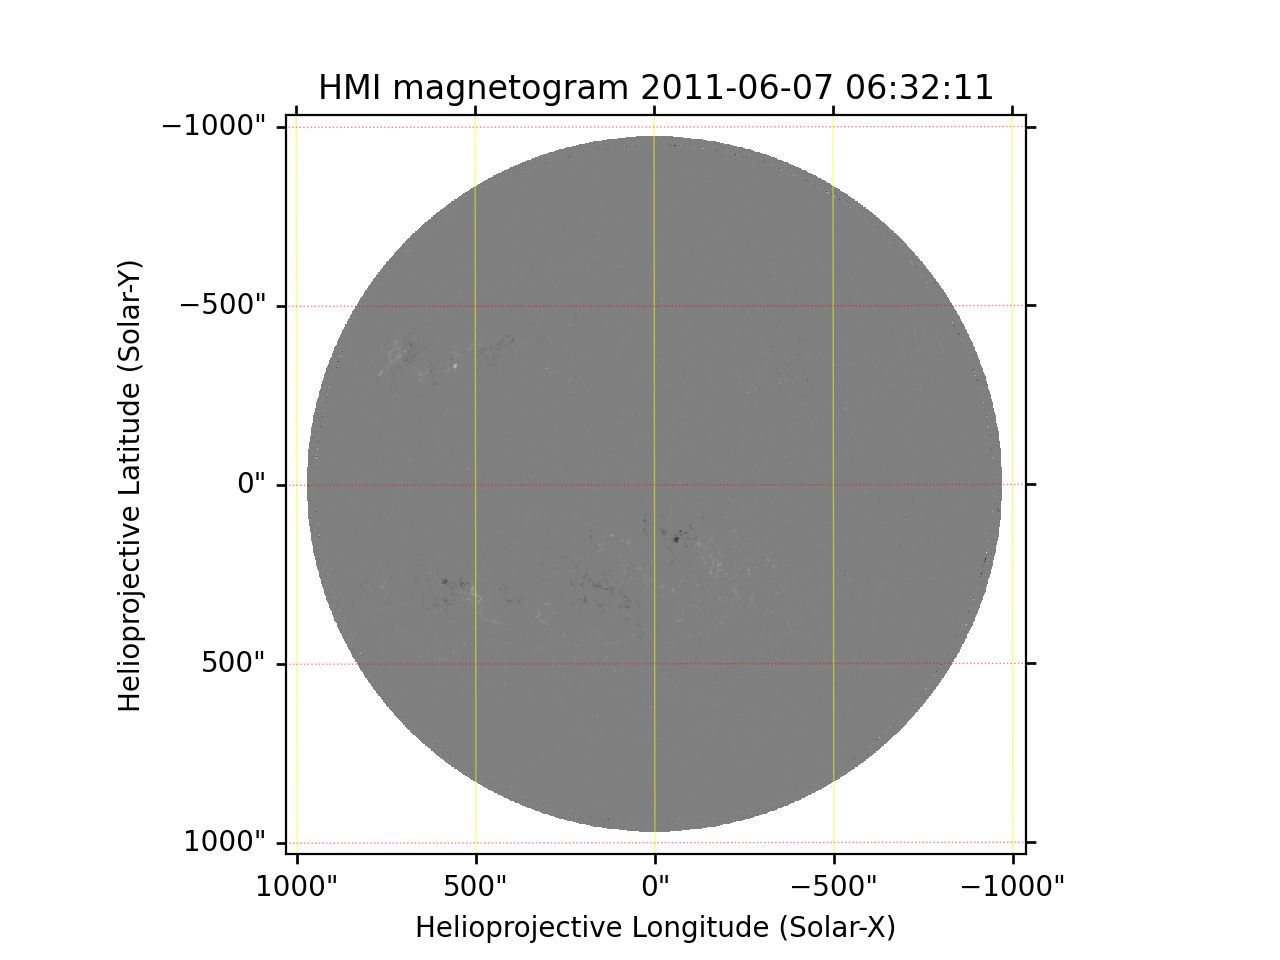
Changing the appearance of Heliographic grid#
sunpy.map.GenericMap.draw_grid allows users to overlay a Heliographic grid on their solar image plot.
This method does not explicitly provide many options for the appearance of the grid lines.
Instead it accepts keyword arguments and transparently passes them onto the underlying infrastructure.
Therefore to change the width of the lines to say, 0.25, and their style to say, dotted, do the following:
fig = plt.figure()
ax = fig.add_subplot(111, projection=smap)

smap.plot(axes=ax)

smap.draw_grid(axes=ax, linewidth=0.25, linestyle="dotted")

plt.show()
(Source code, png, hires.png, pdf)
